Primary Research (Project Theme Questions)
The graph shows that most of the people responded as the software to be set of programs which is correct that shows that most of the people know what is software.
The above pie-chart shows either MS Office or Python is more popular than other software listed above among the people who completed this survey. Some people also choose other software to use.
It shows that every people use some software but they differ according to their needs. However, Word seem to be more in use than other software.
The graph shows the different percentage for each of the application software. 30 percent of students use web browsers and educational software whereas 20 percent chose spreadsheet and other software.
It is clear to see that though people are interested to develop software but only 10 percent of them have made any software to use for themselves.
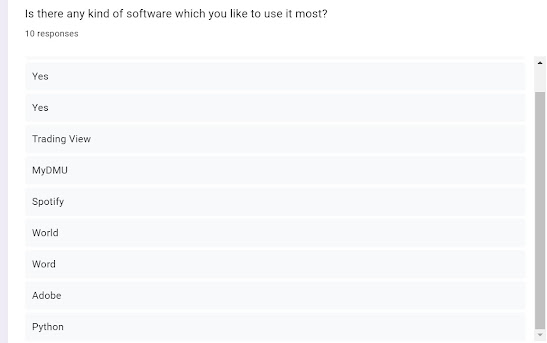
The above picture shows that all the people have different choices for the best software they use but adobe photoshop and Microsoft have more good response than other.


.png)
Comments
Post a Comment